
Welcome To Our July ‘26 Newsletter
In this issue, we step away from our usual format to focus on the broader forces shaping employer-sponsored health plans. We get a little “wonkish” (so stay with us 😊), but we felt it important to examine what recent studies and market shifts tell us about those forces—specifically, what the 2026 Milliman Medical Index, PwC's 2027 cost projections, and Aon's GLP-1 research tell us about cost trends. Then, using this data and this year's regulatory docket, we explore six structural trends running through that data and their implications.
— The Nateev Health Team
The 2026 Milliman Medical Index: What the Data Reveals
Milliman's 2026 Medical Index shows employer healthcare costs up 7.9%—the highest rate in over a decade, excluding the COVID years. The increase reflects structural market shifts, not temporary anomalies.
+7.9% total cost increase | Pharmacy +14.8% | Outpatient +7.5% | Outpatient = 31% of all spend
Where the Cost Growth is Coming From: Pharmacy and outpatient facility care together account for 69% of the year-over-year increase. GLP-1s and other specialty therapies are the primary drivers in the pharmacy sector. Outpatient facility care is the fastest-growing cost category—now consuming 31% of all medical spending.
Percentage Cost by MMI Service Category, For an “Average” Person
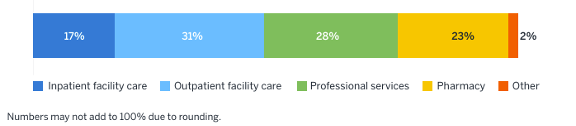
Who's Paying: Employers still cover the majority (58%), but the cost shift to employees is steady and steep. Employee premium contributions have risen from 21% to 27% of total costs since 2005—what Milliman describes as cost-shifting primarily through the paycheck rather than at the point of care.
A New Cost Driver: For the first time in the Index's history, AI-enabled billing optimization is recognized as a cost driver. Roughly half of hospital finance organizations have implemented AI for coding, denials management, and documentation—tools that can increase claims costs even when utilization and outcomes remain unchanged.
PwC's 2027 Projection: No Relief Ahead
Milliman shows where costs stand; PwC's Behind the Numbers 2027 shows where they're headed. Based on surveys and interviews with actuaries at 27 US health plans covering more than 103 million employer-sponsored members, PwC projects a group medical cost trend of 9.0% for 2027—the fifth consecutive year of elevated trend.
9.0% projected trend (2027) | 5th consecutive year elevated | 2026 restated up: 8.5% → 9.0%
Five Inflators, Few Deflators: Plan actuaries identified five forces driving the 2027 trend: AI-enabled documentation and coding, provider reimbursement pressure from consolidation, pharmacy (85%+ say the pharmacy trend is outpacing the overall medical trend), behavioral health utilization, and out-of-network arbitration under the No Surprises Act.
Deflators include continued use of payment integrity programs to ensure plan compliance, targeted utilization management for high-cost claims, and active pharmacy benefit management with class-specific governance.
Inflators are structural, deflators are limited, and there is no more margin for passive management.
Source: PwC, Medical Cost Trend: Behind the Numbers 2027 (June 2026)
The GLP-1 Paradox: Coverage Expansion Meets Cost Reality
GLP-1s remain the primary driver of the pharmacy trend—and the category continues to expand. Prescriptions doubled year over year (3.5 million were filled in December 2025 alone). The FDA approved the first oral GLP-1 for weight loss in April 2026, and weight-loss coverage among large employers rose from 28% in 2024 to 43% in 2025 (KFF). Yet the largest claims-based studies reach opposite conclusions about medical cost offsets—and that conflict matters for every plan fiduciary.
3.5M Rx filled (Dec 2025) | Oral GLP-1 FDA approved Apr 2026 | Weight-loss coverage: 28% → 43%
AON Jan 2026 · 192,000+ users · ~50M lives
– Adherent diabetes patients: medical costs 6–9% lower after 30 months.
– Weight-loss users: 3–7% lower within 18 months.
– Female users: 47% fewer hospitalizations for major cardiovascular events; ~50% lower ovarian cancer incidence and 14% lower breast cancer incidence vs. non-users.
MILLIMAN 2026 Medical Index
– 91% of plan sponsors cover GLP-1s for diabetes, but only 34% also cover weight loss.
– Weight-loss users had fewer ER visits (down 4%) and admissions over 4 years—but total costs rose.
– Adherent patients had drug costs exceeding $18,000/year; savings "unlikely to fully offset the pharmacy cost impact".
PWC Behind the Numbers 2027
– Plan actuaries report that the promise of lower costs from healthier patients "has not yet been seen in industry data".
– New FDA-approved indications and oral formulations are expanding the eligible population faster than any offsets can materialize.
Why They Differ: Different populations, adherence definitions, and time horizons. Aon tracks sustained users, whereas Milliman and PwC count category-wide experience, including dropouts. The cost equation remains an open question.
FIDUCIARY QUESTION: ERISA prudence is judged by process, not outcomes. When credible studies disagree, can you document a reasoned basis for your coverage decision—regardless of the outcome? Cover, exclude, or cover with conditions: review the evidence, set deliberate eligibility criteria, and revisit as data matures.
Sources: Aon GLP-1 research update (Jan 13, 2026); Milliman Medical Index (May 20, 2026); PwC Behind the Numbers 2027 (June 2026); KFF Employer Health Benefits Survey
Recent Regulatory Developments
Several regulatory changes affecting employer-sponsored health plans took shape this year. Key developments and their effective dates:
PBM disclosure (CAA 2026). PBMs become subject to ERISA Section 408 disclosure rules: 100% pass-through of rebates, fees, and manufacturer payments; semiannual reporting; and annual participant notices. The pass-through mandate takes effect August 3, 2028.
DOL proposed rule on PBM compensation (Feb 2026). Would require semiannual PBM compensation disclosure for self-funded plans and could take effect as early as July 1, 2026. Awaiting DOL's timeframe announcement on this.
MHPAEA enforcement. DOL audits continue, with a focus on treatment exclusions, network access, and directory accuracy. Final regulations are expected by the end of 2026.
FTC settlement with Express Scripts. The PBM agreed to pass through rebates and eliminate spread pricing—relevant for sponsors reviewing PBM contracts ahead of 2028.
No Surprises Act Independent Dispute Resolution (IDR) reform (May 2026). HHS, DOL, and Treasury finalized updates to streamline arbitration: lower administrative fees, a centralized IDR Gateway, and five-day eligibility determinations. Useful process relief—but it does not address the provider-favorable award patterns discussed in the trends below.
Six Structural Trends Reshaping the Market
We believe the above data from Milliman, PwC, and Aon tell one story: cost pressures are structural, not cyclical. Here's what's driving it—and what it means for plan fiduciaries.
Consolidation is Increasing Facility Costs
Outpatient facility care has quadrupled its share of spending since 2005. The reason: 97% of metro areas now have highly concentrated hospital markets, and 47% of physicians are employed by health systems—up from under 30% in 2012. The result is a 17% premium on commercial office-visit prices. Same service, same outcome, dramatically different bill.
97% of metros: concentrated markets | +17% office-visit cost uplift
FIDUCIARY IMPLICATION: Site-of-care design is an active fiduciary lever—not a benefit option.
Specialty Pharmacy is Bifurcating
Traditional drugs are stable. GLP-1s and high-cost therapies are not. US oncology spending hit $143B in 2025—up 50% since 2020. CAR-T tops $600K per episode. More than 85% of plan actuaries expect pharmacy costs to outpace medical costs again in 2027.
$143B oncology spend (2025) | $600K+ CAR-T per episode | 85% expect pharmacy to lead trend
FIDUCIARY IMPLICATION: Coverage design now directly determines cost exposure, and with more regulation/litigation, decisions need to be documented.
AI is Optimizing Provider Billing
PwC's actuaries ranked AI-enabled coding the #1 cost inflator for 2027—about 70% put it in their top three. A JAMA study found AI scribes added ~$3,044 in revenue per physician annually with no change in claim denials. A BCBSA analysis found that coding intensity alone added $22M in maternity spend, while actual treatment patterns barely changed. Costs are rising without utilization rising.
#1 inflator per PwC actuaries | +$3,044/physician (JAMA) | +$22M maternity spend (BCBSA)
FIDUCIARY IMPLICATIONS: Your TPA processes what providers bill; it does not adjudicate on your behalf. Reclaim that agency: require quarterly reports on coding intensity and severity drift by facility, establish clinical review rights for high-cost claims, and treat unexplained complexity shifts as a plan asset at risk — not a vendor problem to resolve.
Regulatory Pressure is Tightening
PBM pass-through mandates, DOL enforcement, FTC settlements, and escalating ERISA litigation are converging — and they're handing plan sponsors something they haven't had in years: regulatory leverage. Courts and regulators are raising the bar, but they're also creating the legal and contractual grounds to demand more from every vendor relationship.
FIDUCIARY IMPLICATIONS: The regulatory environment has shifted in your favor. Use it: audit your PBM contract against the new CAA disclosure requirements, demand full pass-through of rebates and fees, and treat the FTC settlement precedent as a template for your contract's requirements.
Out-of-Network (OON) Arbitration is a Durable Inflator
The No Surprises Act shielded members from balance bills—but its IDR process for OON care has become a revenue channel for providers. Nearly 4.8 million disputes were filed through 2025 (vs. a projected 17,000/year). Providers won 88% of determinations in H1 2025. Four organizations drove 56% of all filings. Courts dismissed the first insurer challenges in April 2026, narrowing options for after-the-fact relief.
4.8M disputes filed | 88% provider win rate (H1 2025) | 4 orgs = 56% of filings
FIDUCIARY IMPLICATIONS: OON exposure in emergency, imaging, and anesthesia is less predictable. Make network strategy deliberate, not default.
Behavioral Health is Rising—and Manageable
Behavioral health visits rose 62.6% from 2018 to 2024 and now account for two-thirds of all telehealth volume. Unlike the other five trends, this one has a proven lever: timely outpatient behavioral care cuts related ER visits by 35%, and a JAMA study found that enhanced behavioral benefits returned $190 in reduced medical claims for every $100 invested.* The data is no longer ambiguous — the question is whether you're contracting for outcomes or just access.
+62.6% visit volume (2018–2024) | 35% fewer ER visits | $190 return per $100 invested
FIDUCIARY IMPLICATIONS: Behavioral health is the one trend where the fiduciary holds the lever. Restructure vendor contracts around avoided ER utilization and total medical cost reduction, then require quarterly reporting on those metrics. Engagement rates and app downloads are vendor metrics; avoided claims are yours.
* Spring Health / JAMA Network Open (2025). Study funded by Spring Health; conflict of interest should be considered when applying findings.
Why Peer Community Matters in This Environment
These structural trends don't have simple solutions—even PwC closes its report by urging industry leaders to collaborate. Employers working together—sharing insights from peers who are navigating the same dynamics—are finding answers faster than those working in isolation.
Our Plan Sponsor Fiduciaries Roundtable convenes leading decision-makers currently addressing these pertinent questions.
– How do we minimize compliance risk?
– How do we improve business outcomes?
– How do we make GLP-1 coverage decisions defensible?
– How do we audit vendors effectively?
– How do we guide employees toward lower-cost care without restricting access?
– How do we stay ahead of shifts in public policy?
This roundtable isn't a conference. It's a working group built around today’s challenges.
→ Learn More About Our Plan Sponsor Fiduciaries Roundtable
Empowering employers and innovators to transform healthcare by aligning business performance with employee well-being.